

Creating a Report
Creating a Report
How to create a report on Waterways Dataviewer
Step 1
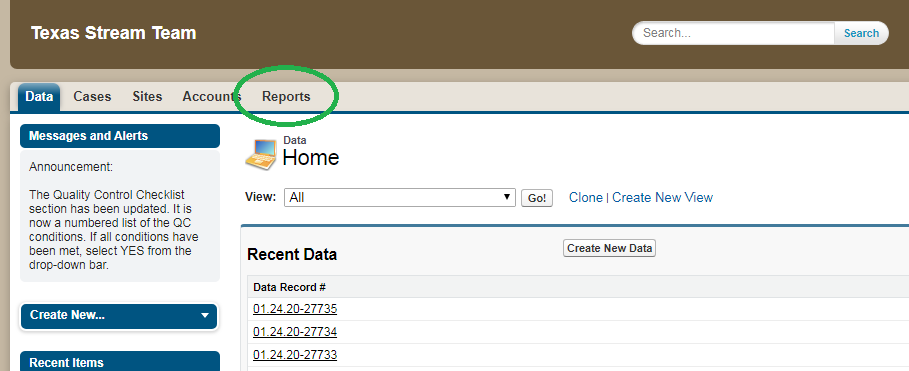
Reports allow group leaders to export chosen data to an Excel spreadsheet or text file. Select the Reports tab to navigate to the Reports page.
Step 2
Click New Report... to start creating a report. Reports you create will show up in the My Personal Custom Reports folder.
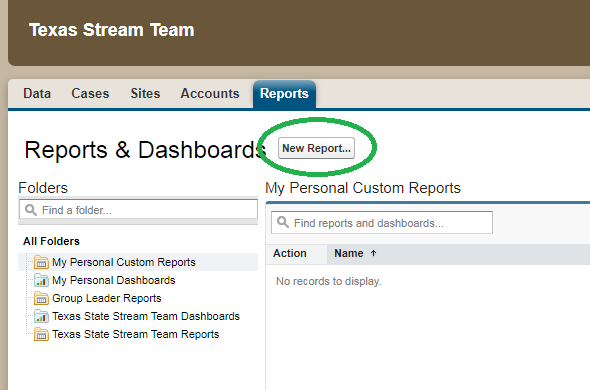
Note that while you can browse reports in the other folders, you will not be able to see data unless it is your group data.
Step 3
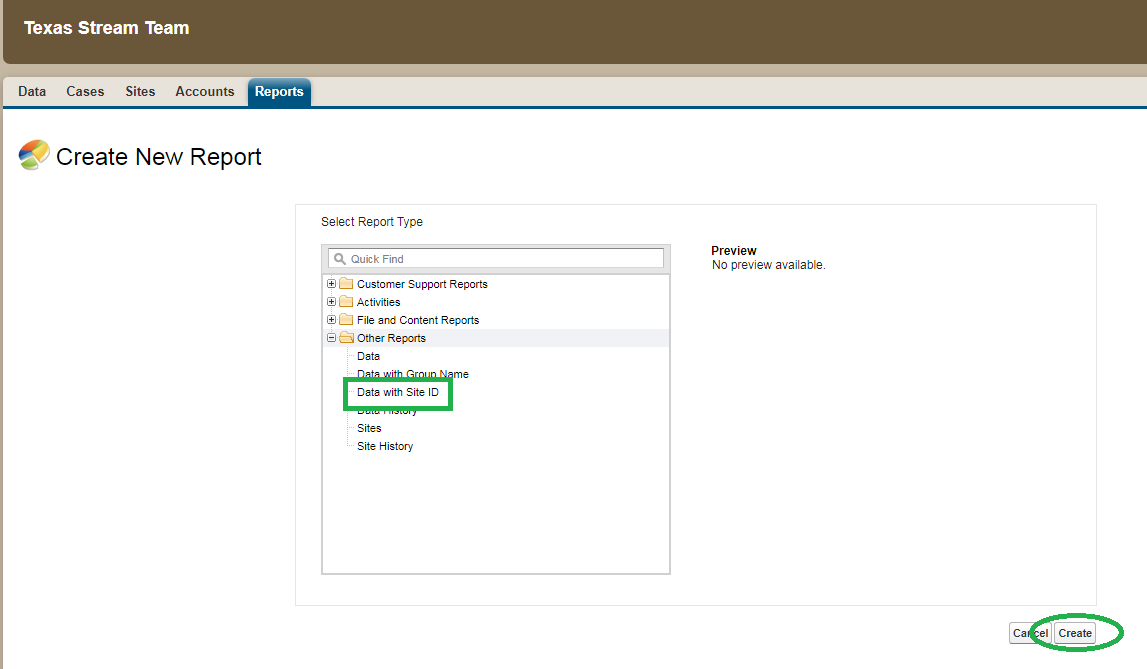
On the Create New Report page, select Other Reports --> Data with Site ID, then click Create to start customizing your report.
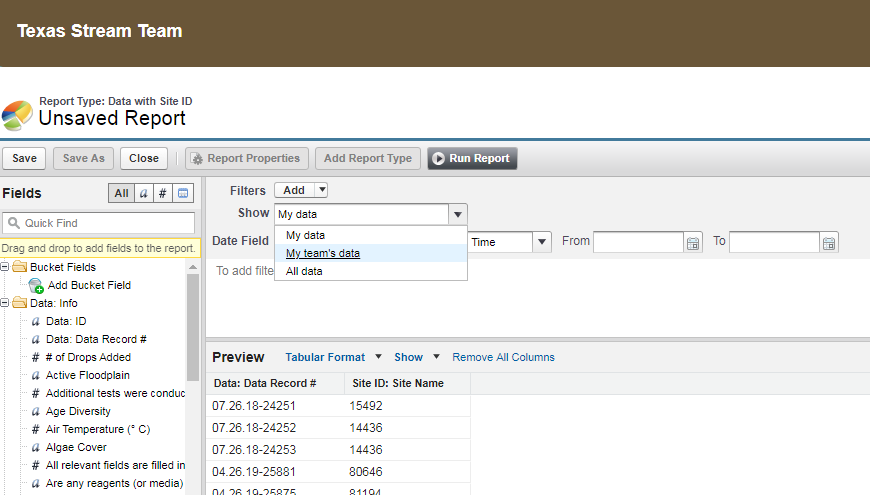
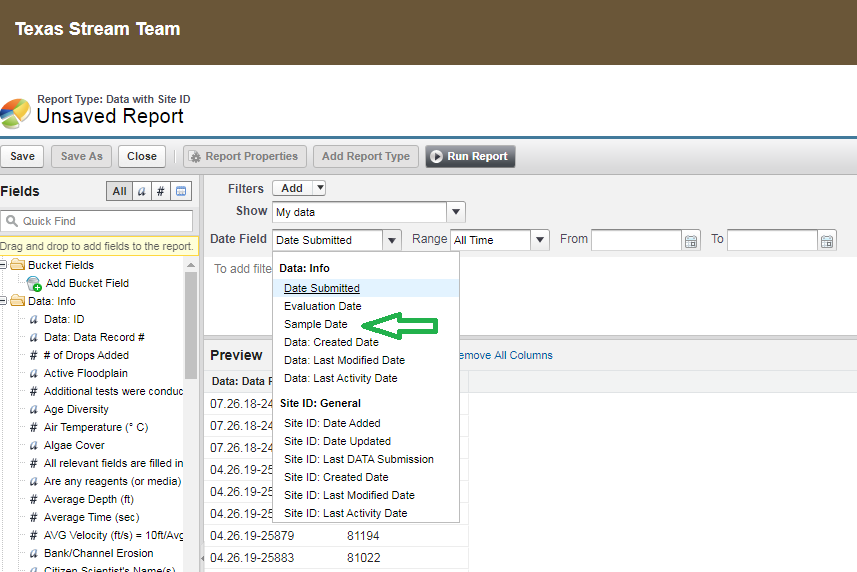
Step 4
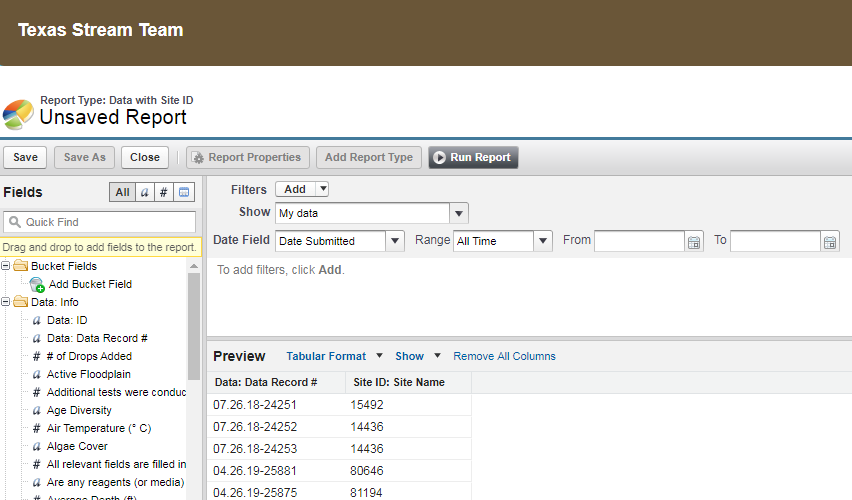
This is the customization screen, where you can choose which fields you wish to include, the date range, and summary options. Be sure to select My team’s data so that you see all the data for your group. Also, select Sample Date in Date Field to see all the sampling events within the time frame you specify.
Step 5
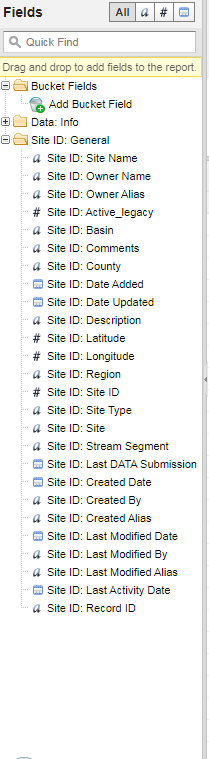
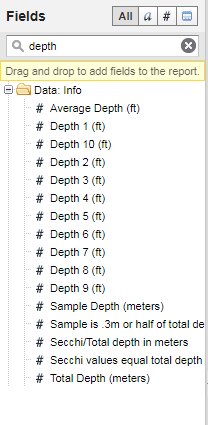
The Fields section on the left includes all the fields available for your report. The Data: Info section includes water quality fields entered on the data sheet and the Site ID: General (scroll down or collapse the Data: Info folder) includes information specific to sites, such as location and county.
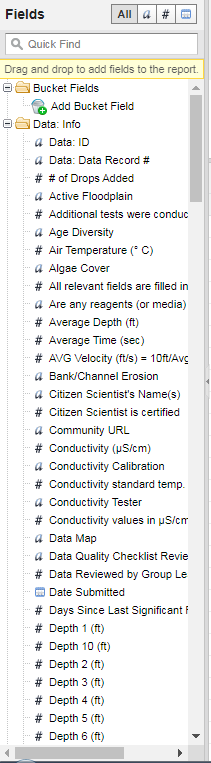
Quickly find fields using the Quick Find search box.
Step 6
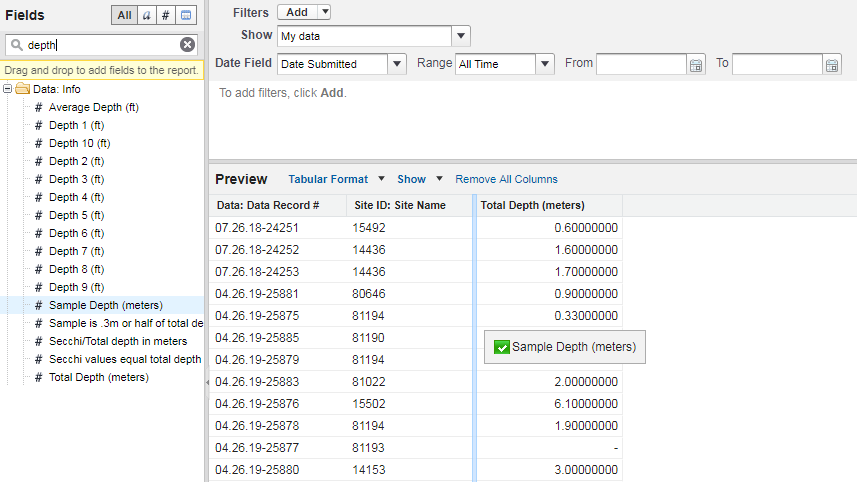
By default, the Data Record # and Site Name fields are included in the report. Drag fields to the table preview section. Columns can be reordered, removed, and sorted here.
You can also choose to group your data by a field, such as Site ID or Sample Date. Click on the column menu to pull up the options and select Group by this Field.
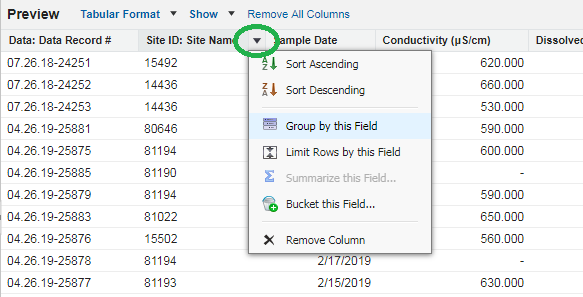
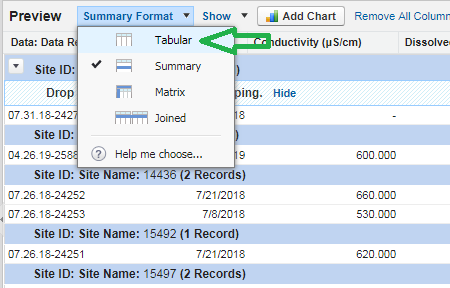
Grouping summarizes the data by the chosen field and can be removed by returning to Tabular format.
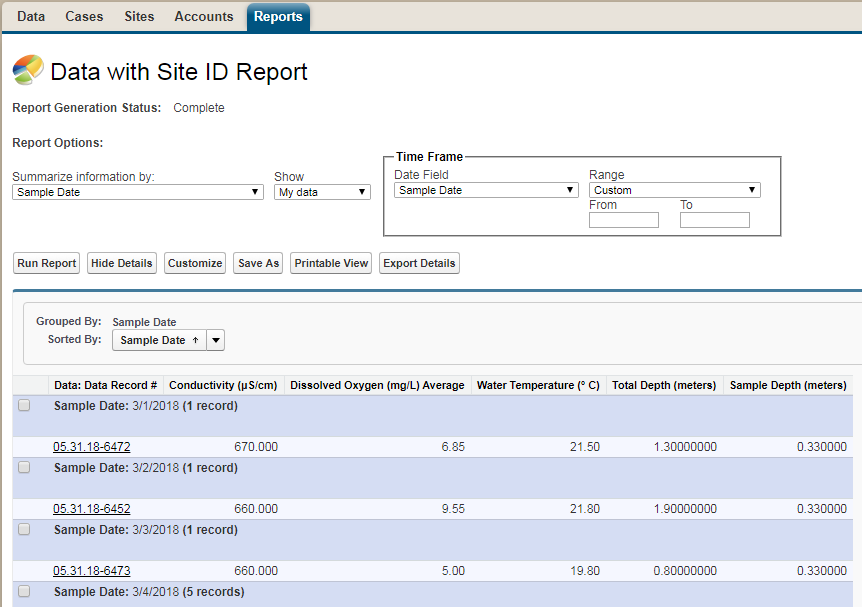
Step 7
Run the report to preview the data before exporting it to a spreadsheet or text file. Note that while you are adding fields on the customization window, only a limited number of records are displayed. Once you run the report, you have the option to change the summary field and the date range. If you change these options here, click the Run Report button to generate the report with your changes. You can return to customizing your report by clicking the Customize button.
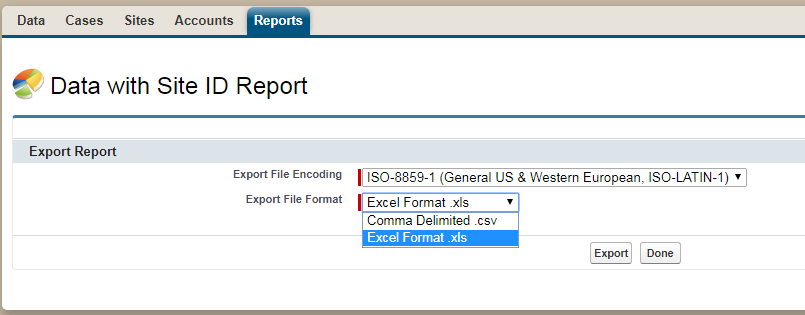
Step 8
Click Export Details. Select the format you would like to export the file in, an Excel spreadsheet or a comma-delimited text file. Text files can be opened in Excel. You should not need to change the default file encoding.
You can now name and save your report.